The last few months have been a bit chaotic. I concentrated on how to create, update and modify maps. The aim is to obtain maps in SVG and PDF that can be used offline. And, perhaps, have a way to match data from excel files (or csv/json).
Preamble
One of the problems I have is about creating thematic maps. For certain reasons that I am not here to explain, I prefer to work offline as much as possible. It complicates things but allows you not to depend on the condition of the network. Over the years I have tried various solutions, the last one is to use SVG files. The problem is finding well-made maps in this format. For a while I got away with some files from Wikivoyage. But reality has a nasty habit of constantly changing and what was true a decade ago may no longer be true today.
I found an old article by Alessio Cimarelli preserved on archive.org: Perfect maps in SVG. Although we are talking about a technique of ten years ago, I found the reading very interesting. Indeed, more than interesting: he showed me a path to follow
The problem and a quick fix
My problem is quite specific but I think the procedure for solving it can be easily generalized. So:
How to create GeoJSON files starting from ShapeFile files? How to convert GeoJSON to SVG file?
Without going into the technical, the steps to take are basically these:
- get the shapefile files
- extract from the file portions of the territory
- reduce map accuracy to reduce file size
- save this selection as a GeoJSON file
- convert the file from GeoJSON to SVG
- finally correct the size and layout of the SVG file
These are quite simple points. However, it is worth going into a little more detail.
Download the shapefile files
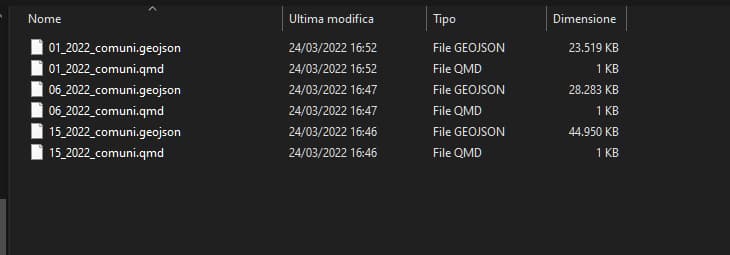
Of course it depends on what we need. In my case, the Italian administrative boundaries by ISTAT are ok. For some years now, ISTAT has published shapefiles of Italian municipalities, provinces and regions. I download the generalized version (the lightest one) and extract the files to a specific folder.
More specifically, the municipality of Milan publishes some open data in various formats through the website dati.comune.milano.it. There are many interesting maps, often already in GeoJSON. I’m interested in these:
- Nuclei d’Identità Locale (NIL) VIGENTI - PGT 2030
- House numbers with geographic coordinates
- ATM - Underground lines routes
- ATM - Metro lines stops
- Education: location of the universities of Milan universities
- Education: localization of secondary schools
- Public transport: location of the railway network
- Public transport: location of railway stations
Regarding the Lombardy region, I can consult the page:
Save and check shapefile files
After downloading the various files, I can begin to select the portions of the territory that I am interested in analyzing. To do this I can use a GIS software. There are many. Over time I have used 3 different programs, all 3 for free:
I’ve used OpenJump quite a bit. The other two less.
The basic procedure is the same for all 3: select the elements of interest and save them as a new file in GeoJSON format.
But first of all you need to check that the geometries are correct.

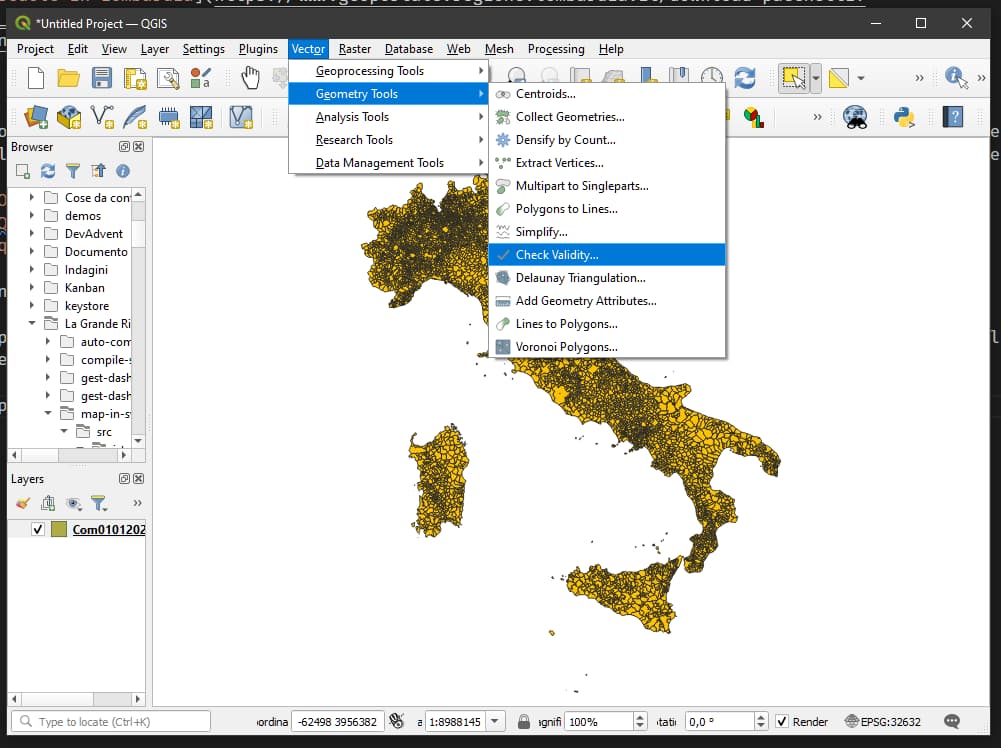
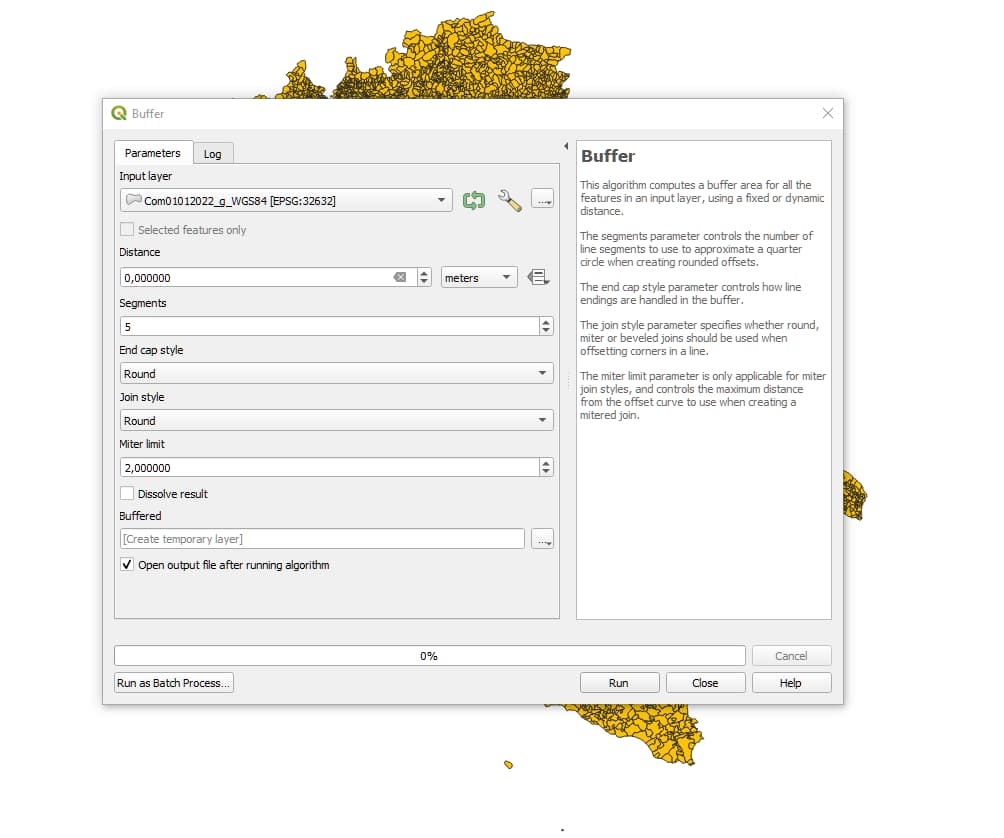
With QGIS just go to the Vector/Geometry Tools/Check Validity menu. It may happen to find some geometries with the Ring Self-intersection error. To correct this you can use Vector/Geoprocessing Tools/Buffer.

I am not worried about the loss of precision in the geographic coordinates: I want to get a light and easy to handle SVG file, even at the cost of losing the coordinates themselves.
Save as GeoJSON
The next step is to save the map as GeoJSON. To do this, I just need to save the layer by choosing the format that interests me. Among the options available is coordinate_precision: I can lower it (for example from 15 to 6) to reduce the precision of the coordinates and therefore the file size.

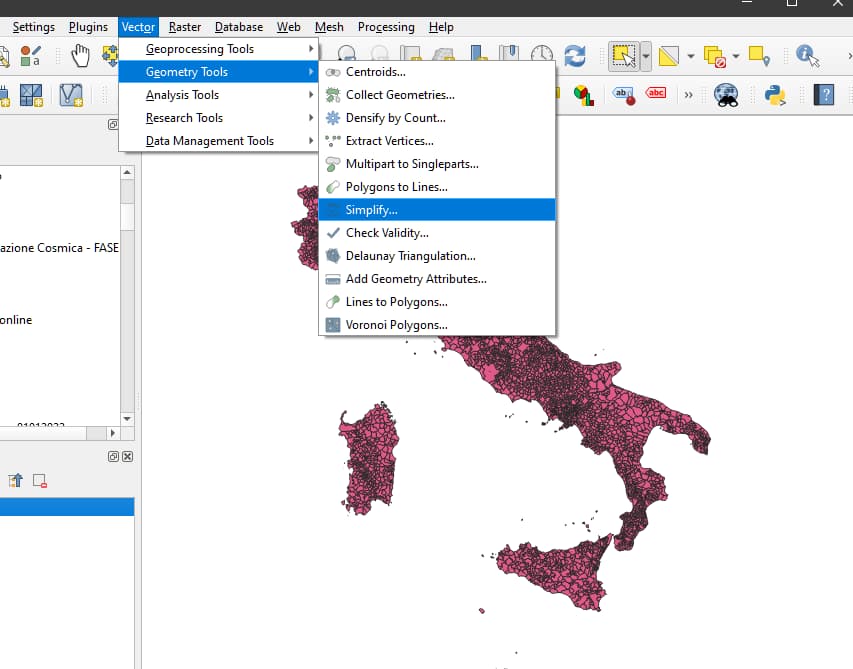
However, I am still not satisfied. I need a smaller file, so I use Vector/Geometry Tools/Simplify.

To find the right size, you need to do some tests.
After fixing the GeoJson file it’s time to convert it to an SVG file. But this will be the topic of a new post.


