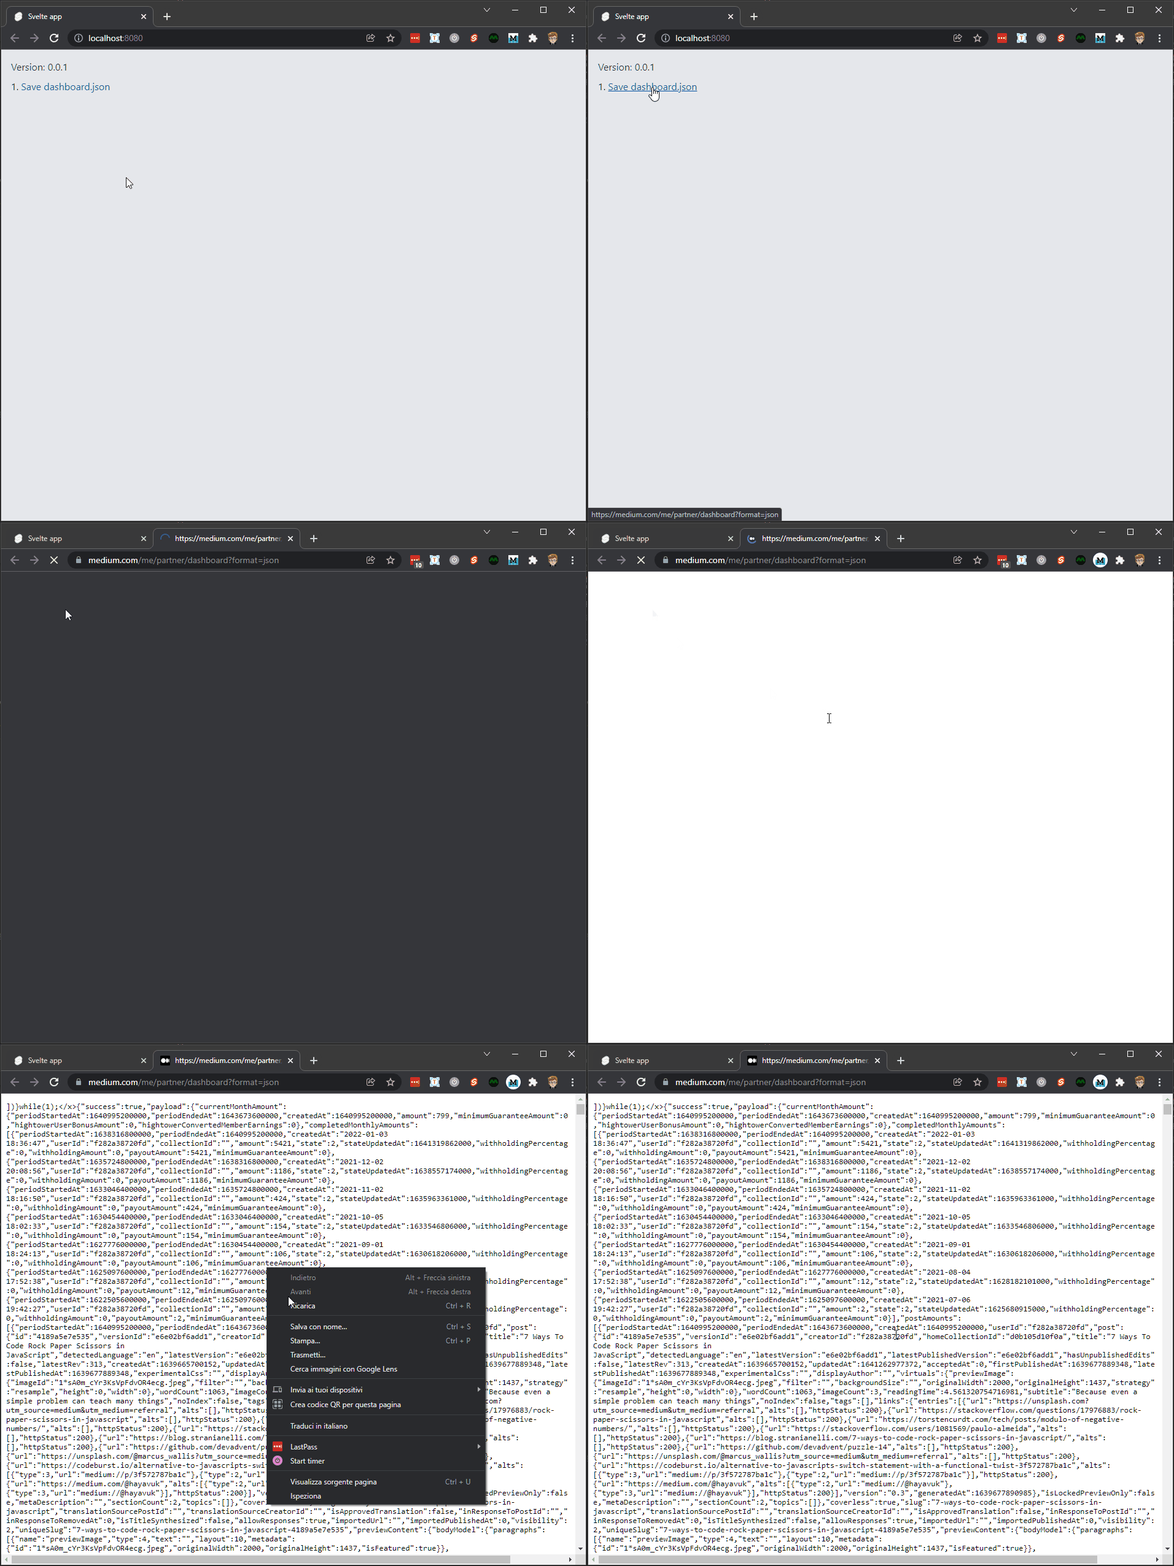
It is quite common knowledge that Medium does not provide in-depth stats. It is not a problem but I am used to recording some data on what I write and program. So I’m looking for an easy way to keep basic information.
There are some interesting posts. Of all the most interesting is How to Get Medium Story Stats with 3 Lines of Python Code by Saul Dobilas. I started from here to understand how to download and analyze Medium’s stats.
Partner Dashboard
First of all: to download the various statistics you must first be logged into Medium. After that you can download some JSON files with some data.
Saul recommends medium.com/me/stats?format=json&count=100. From that page you can download a JSON file with data from the last 30 days. But I prefer a slightly different approach.
Forcing the reasoning, the only truly objective parameter of Medium is related to monetization. The views, reads, claps and so on also count. A number is enough for me: how much has each story monetized?
Yes, I know, it sounds like a venal speech. And what’s more, my “earnings” are small, indeed very small. But I want to start from here.
To do this I need a JSON file containing the earnings data. To obtain it, I use the address: medium.com/me/partner/dashboard?format=json.
This file is interesting, it contains some useful data. First of all, the first letters must be eliminated:
])}while(1);</x>
This string is the remnant of an old problem now solved. There is an article from over ten years ago that explains it well: JSON Hijacking.
The JSON file consists of several parts:
I don’t care about everything, of course. What interests me is this:
Current Month Amount
currentMonthAmount contains the current month’s data:
I’m not sure what the last three items mean, but the first ones are dates that identify the reference period.
To convert a timestamp into a more readable format just use Date.prototype.toDateString():
amount instead represents the total “earned” during the month. Of course, it’s cents, not whole dollars.
Completed Monthly Amounts
completedMonthlyAmounts contains the data for the completed months. It’s an array with an object for each previous month:
In addition to the previous data, some additional information is saved: the user ID and the time when the data is consolidated. I don’t know what is meant by state.
Post Amounts
postAmounts is an array containing some interesting data for each published post:
I am not examining all the items, also because I have not copied them all. However, there are some data on which I want to emphasize:
totalAmountPaidToDate: is how much a story has earned since the day it was publishedtotalAmountInCents: is the earning of the story in the current monthpost.id: is theidthat uniquely identifies a story within Medium. I can access the post with the story using an address likehttps://medium.com/story/id. For example, my latest post can be reached via the address medium.com/story/9db50dff8f38post.homeCollectionIdis theidthat identifies the publication hosting a story.post.title,post.virtuals.wordCountandpost.virtuals.readingTimecontain some of the title of the story, the word count and an estimate of the reading time
With this information I can begin to create something to download, store and analyze my story data on Medium.
How to download Medium stats
So, in summary, I go to medium.com/me/partner/dashboard?format=json and save the page. Just use the right mouse button and choose Save As.... To help me, and to remind me of all the steps, I create a small app. I start from a template with Svelte, Typescript and TailwindCSS already configured: el3um4s/memento-svelte-typescript-tailwind:
npx degit el3um4s/memento-svelte-typescript-tailwind medium-stats
cd medium-stats
npm install
So, the first step is to remember to download the most up-to-date stats. I add a link to the page using Svelte:

Import a JSON file
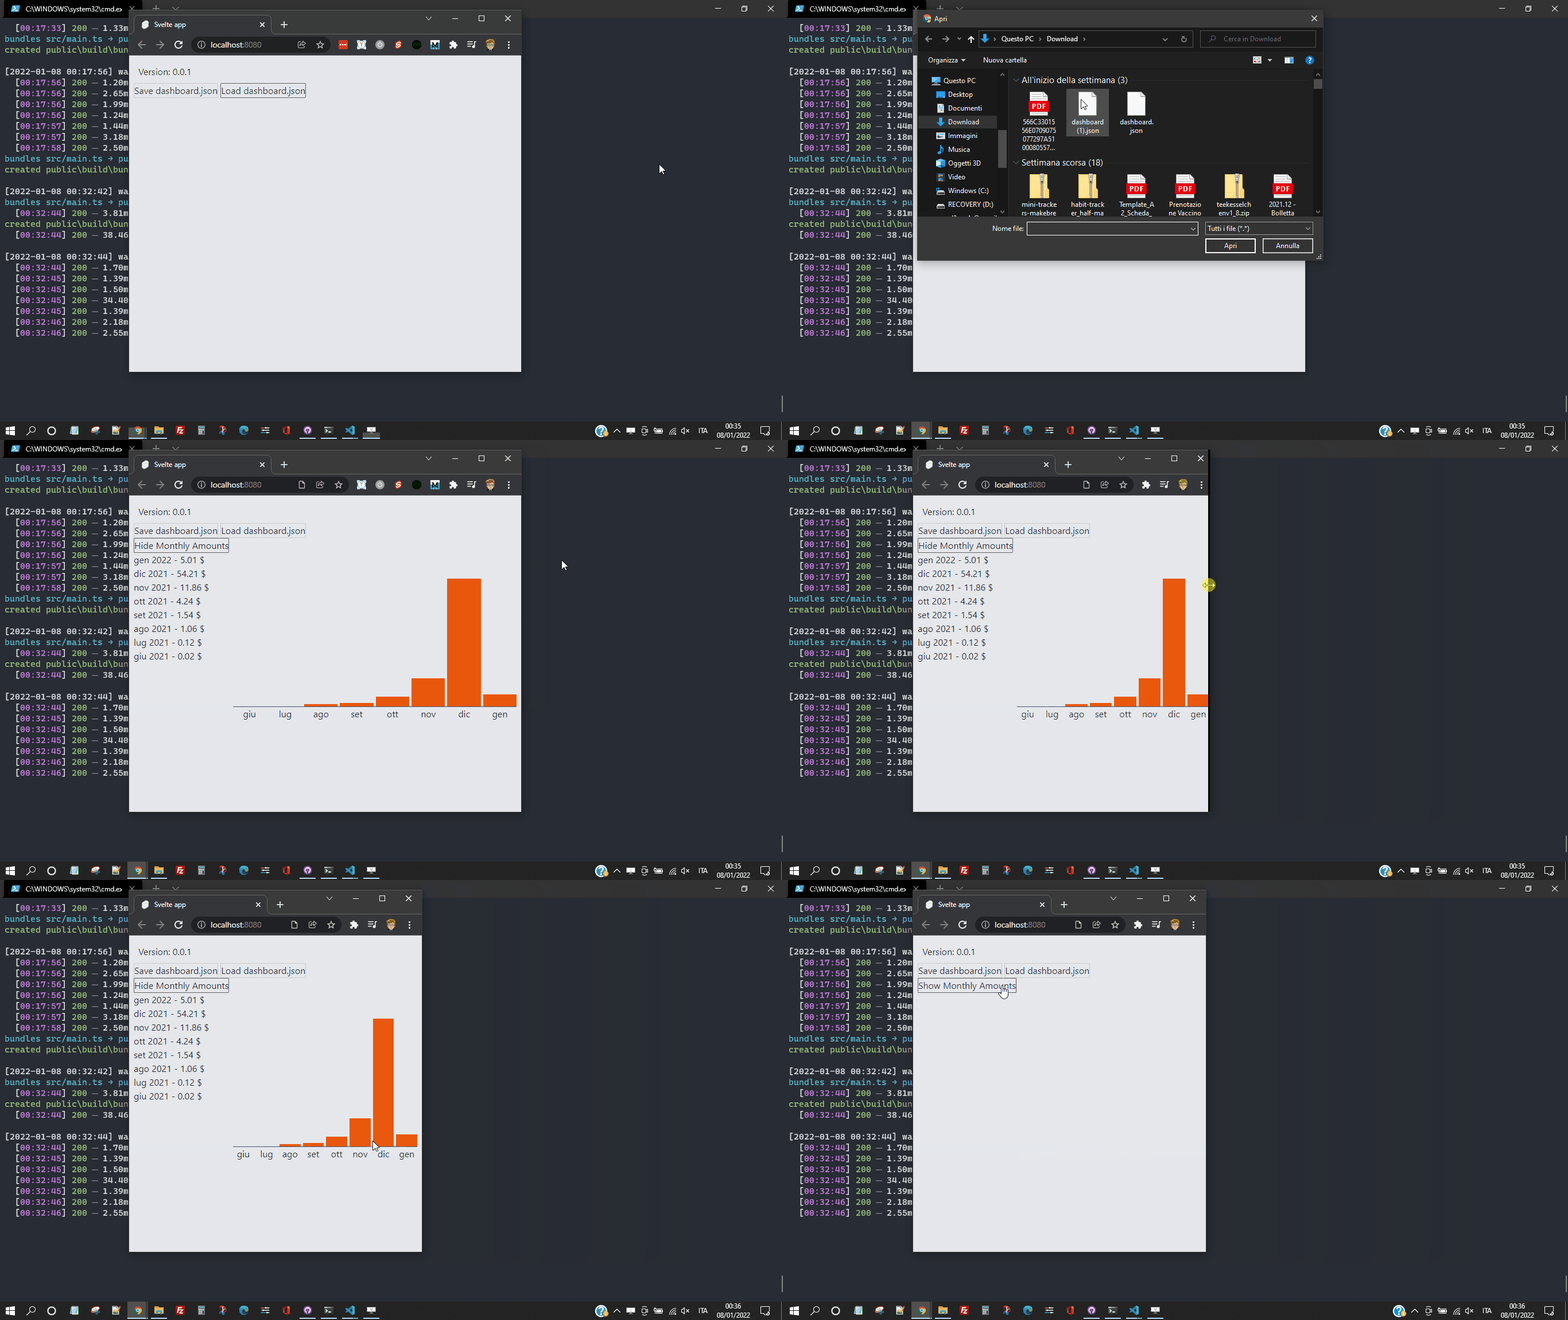
After downloading the dashboard.json file I can import it into my application using the File System Access API. The idea is to upload the file with the statistics and extract only those that interest me. Then, at a later time, and probably in a future post, I’ll combine this data to give it the shape I’m interested in.
Let’s start with creating a button:
I add a function:
I use showOpenFilePicker() to open a system window and select the file to use. Then with getFile() I load the file into the page. Finally I use text() to extract the content and save it in a variable of type string.
With a normal JSON file at this point it would be enough to use JSON.parse() to get an object. But in this case I have to delete the characters])} ])}while(1);</x> first. I create the sanitizeOriginalStats() function:
I add this function to loadDashboardJSON().
Analyze the data
Now that I have my data I can decide how to view them on the screen. As a first test, to test my idea, I decide to limit myself to something simple. I want to create two lists. The first with the proceeds of each month. The second with the progressive revenue of each post.
I start with the monthly proceeds. To get it I use the properties currentMonthAmount and completedMonthlyAmounts. For both it is sufficient to use periodStartedAt and amount. I create a function that helps me extract this information:
Dates are a difficult type of subject to deal with. To get something readable I have to use some methods:
I create the getDate() function:
And I use it in getMonthStats():
Now I can extract the data of the current month and those of the previous months with:
I modify the button and add a list in which to show the various values:
So on the screen I can see something like this:

Add a chart
The next step is to figure out how to graphically display the values. There are 3 libraries to consider:
What interests me is quite simple so I create a basic component to draw a histogram.
I start with setting the variables
datafor the data to showlabelscolumnsfor the number of vertical bars to showmaxDatato scale the bars correctly
I also need a way to manage some styles based on the amount of data to show:
I add the html part:
To make the graphical representation proportional I use height:{(d / maxData) * 100}%.
As for the CSS part I use a grid:
I create a helper function to extract the dataset that interests me:
To dynamically manage the graphical representation I use $:
Finally I add the graphic to the main page:
This way I can get something like this:

Okay, that’s enough for now. There are still things to say: I will write another article on this topic in the near future.


