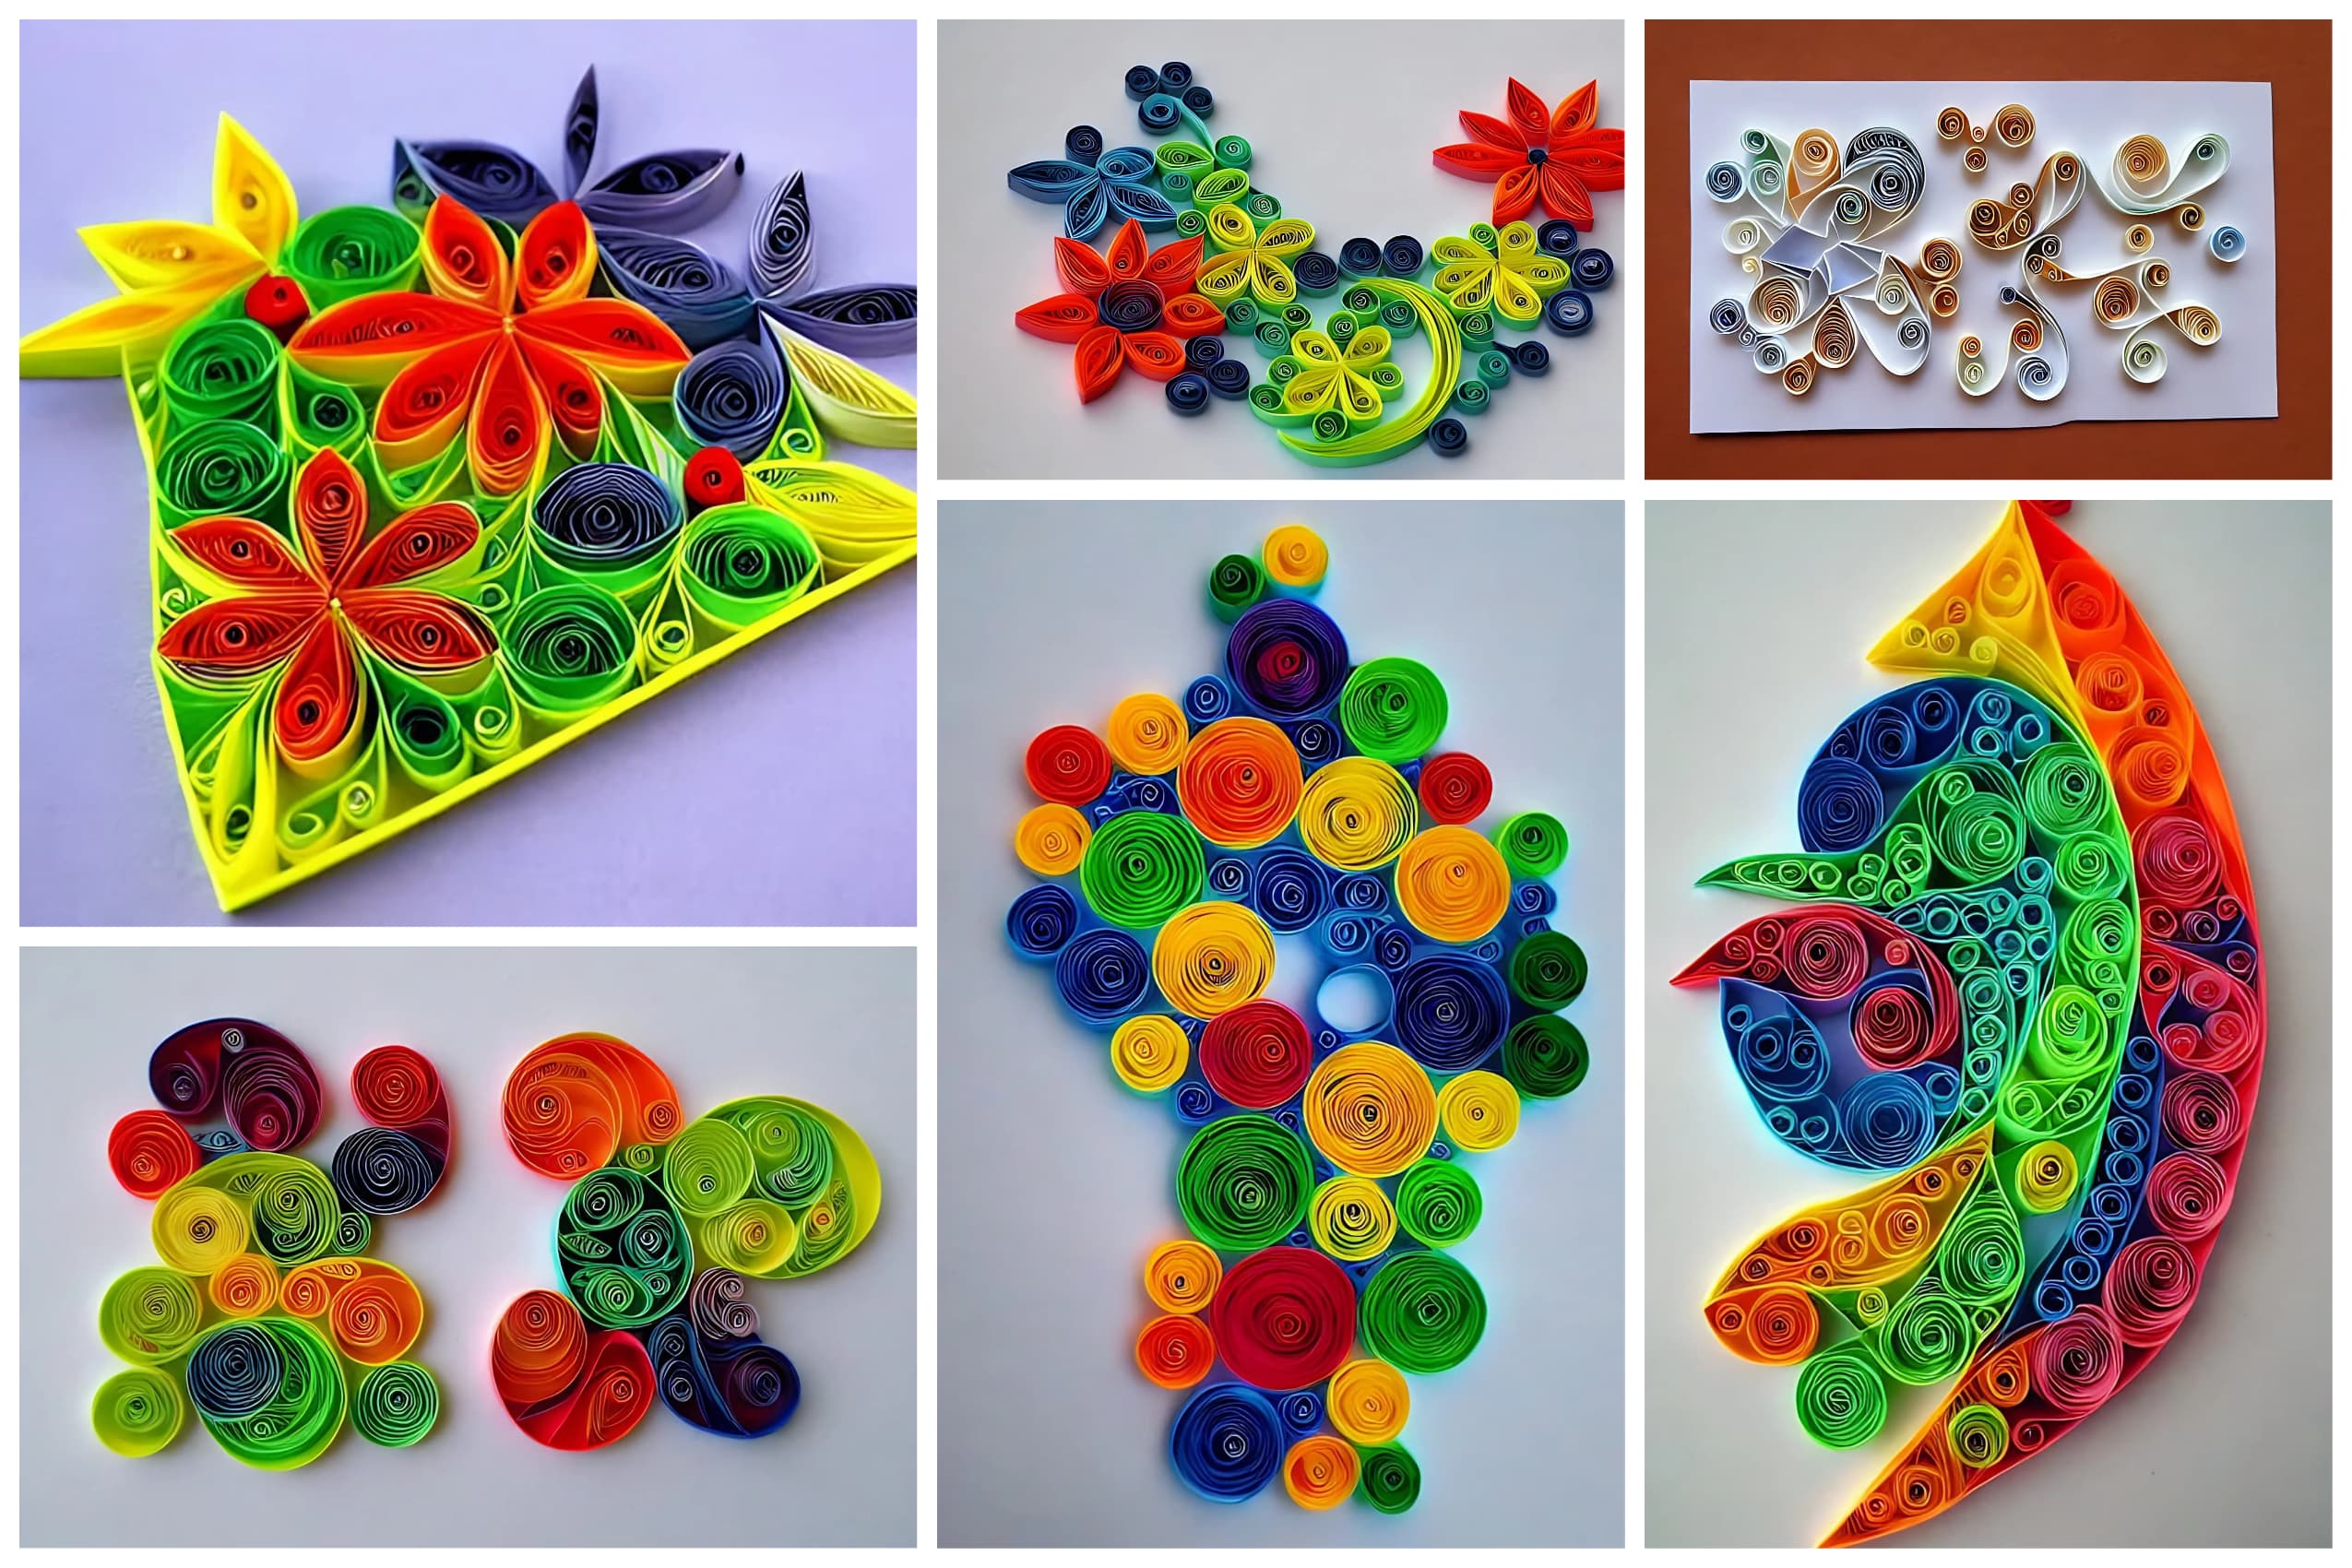
Over the past few weeks, I’ve written a lot of posts about JavaScript. I realized that the images available online to illustrate mathematical and IT concepts are always the same. That’s why I decided to illustrate my stories with AI-generated images.
There are various possibilities. I decided to use a cheap solution (Lexica.art) and to keep a uniform style. I’m not a designer, so I don’t want to spend too much time on this. I just want to have a nice image to illustrate my posts.
Kawai Cute Little
Of all the variants, my favorite is to use kawai cute little as keywords. In this way I obtain delicate images, with rounded strokes and warm colours. It’s an effect I like. Let’s try some examples.
If I want to plot a graph, I can use a prompt like this:
kawai cute little representation of bar graph on a wall, beautiful light. soft colour scheme, 8 k render

If I want to represent a series of letters instead I can try:
kawai cute little alphabet, beautiful light. soft colour scheme, 8 k render

Finally if I’m interested in an image with numbers:
kawai cute little representation of numbers, beautiful light. soft colour scheme, 8 k render
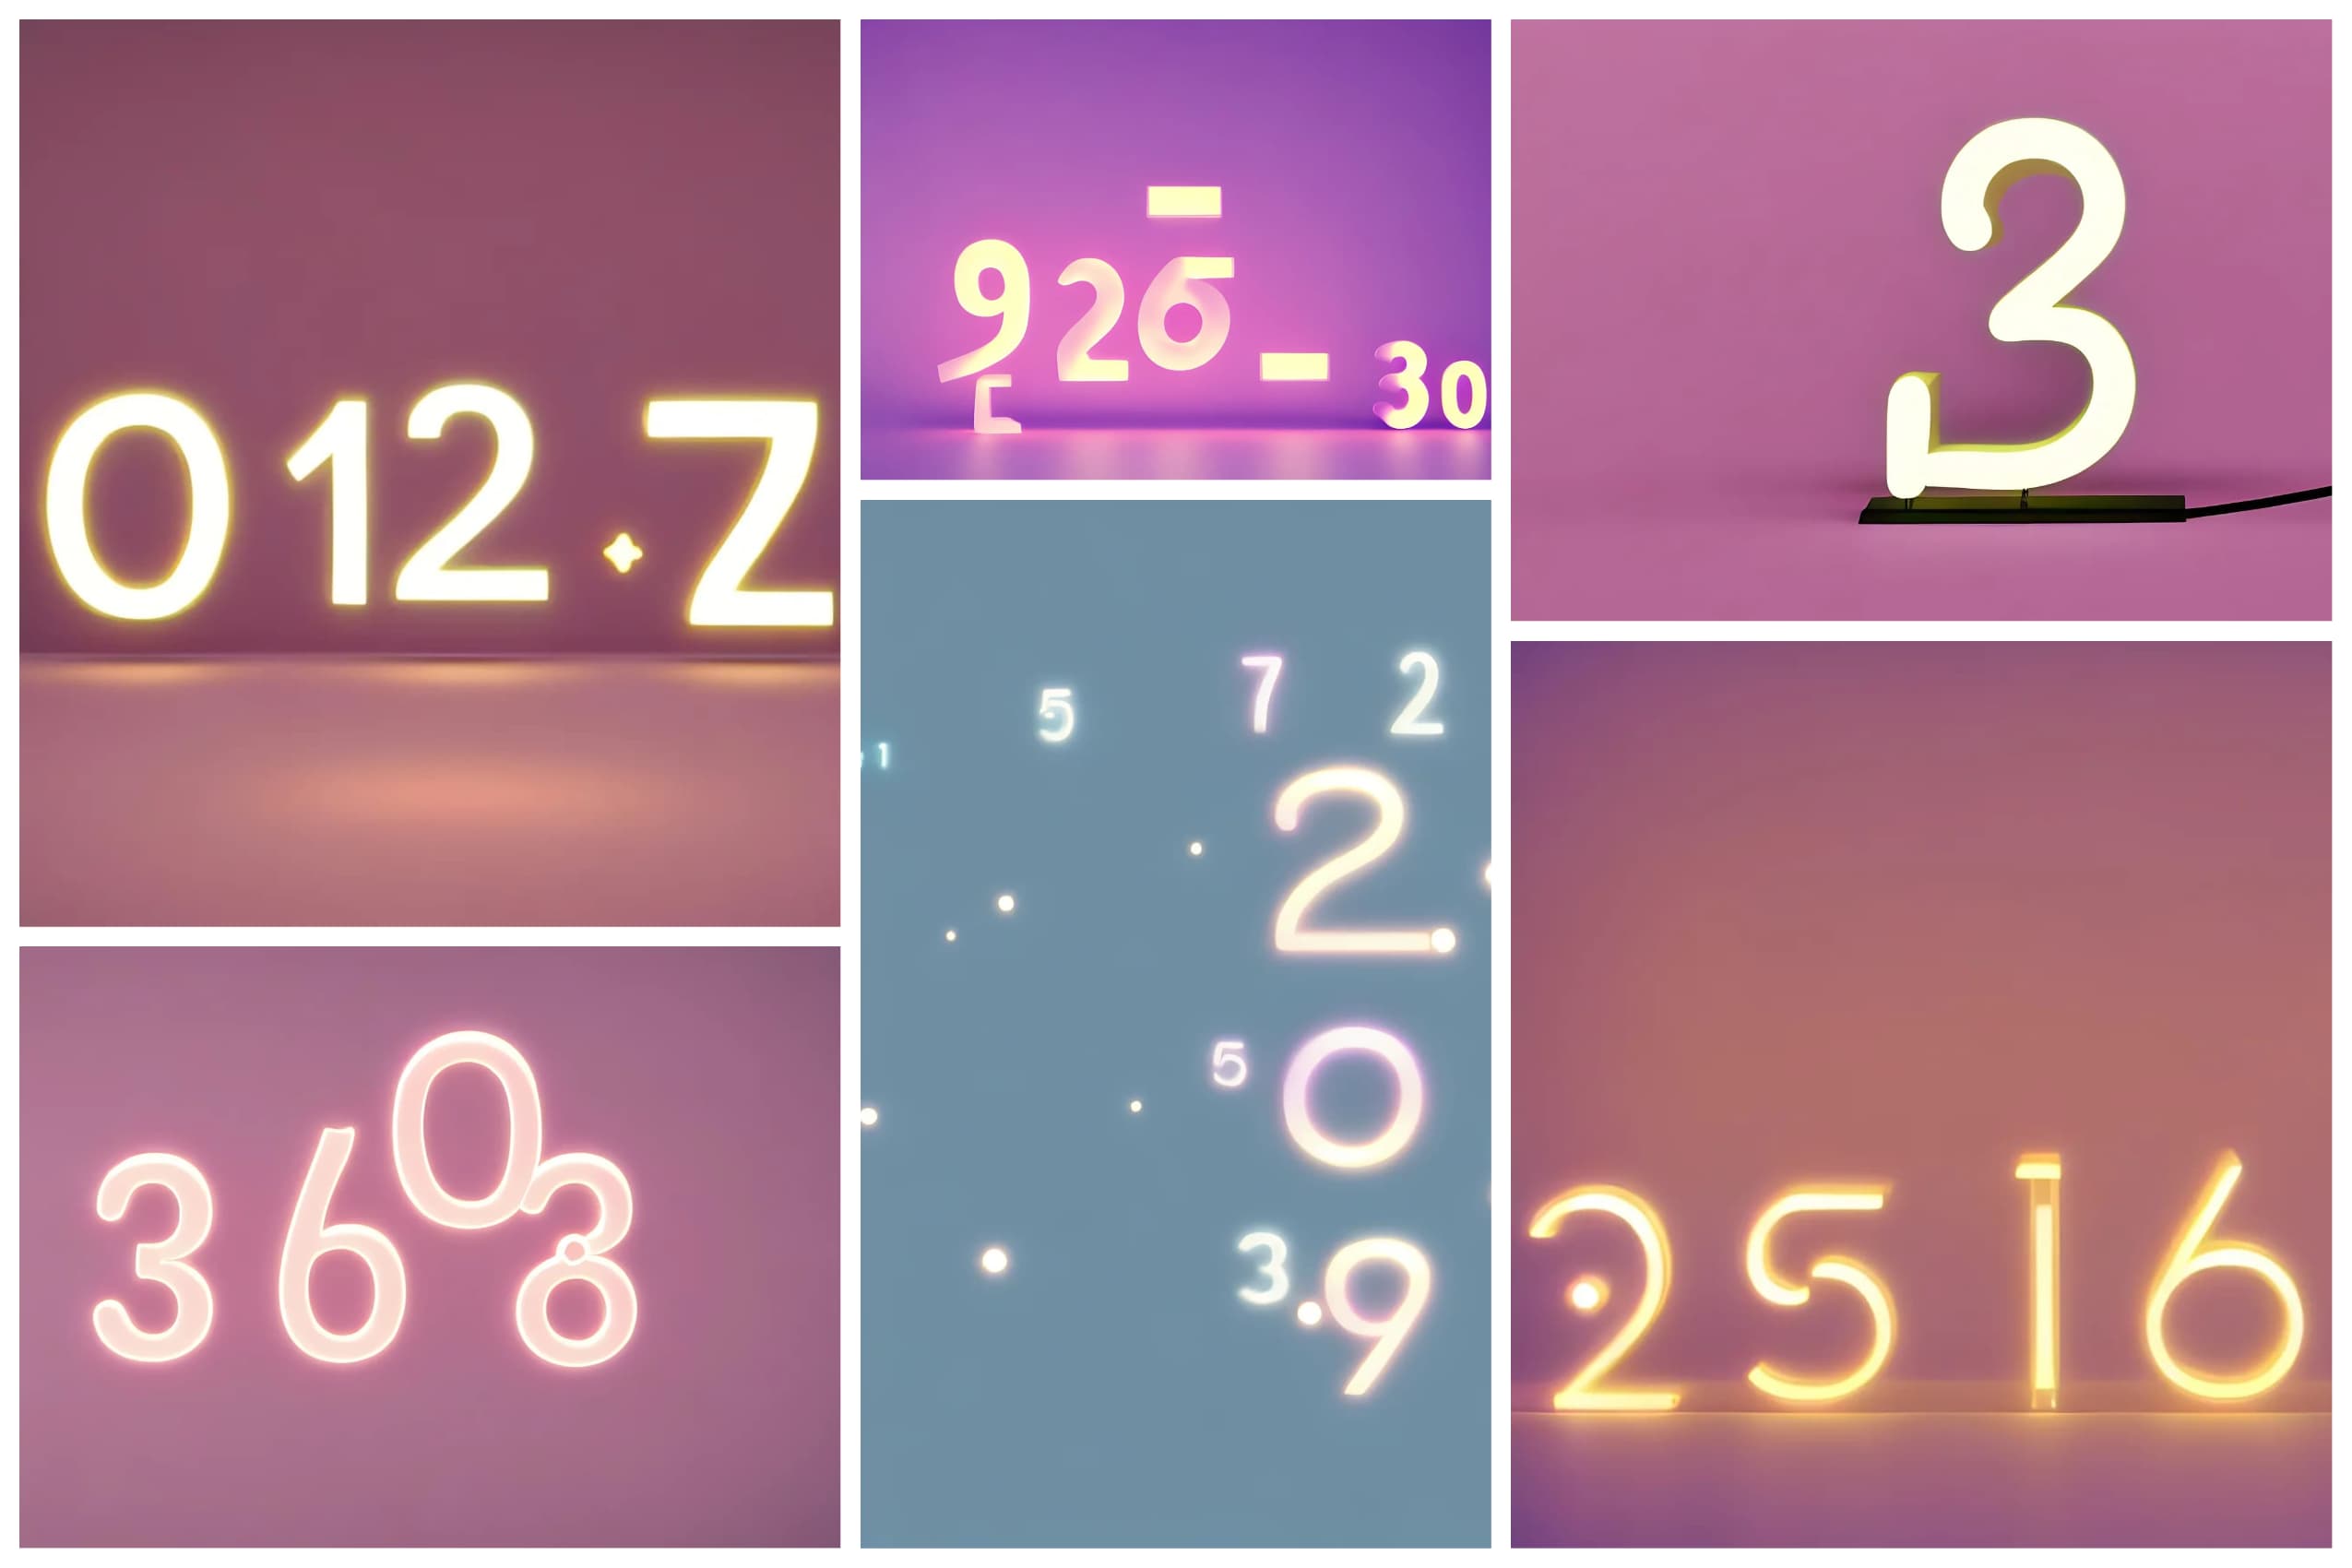
Once you have found a style it is interesting to use it for several posts, in order to give a homogeneous effect. For example I can also try with these styles (by the way, I recommend reading this story by Exquisite Workers).
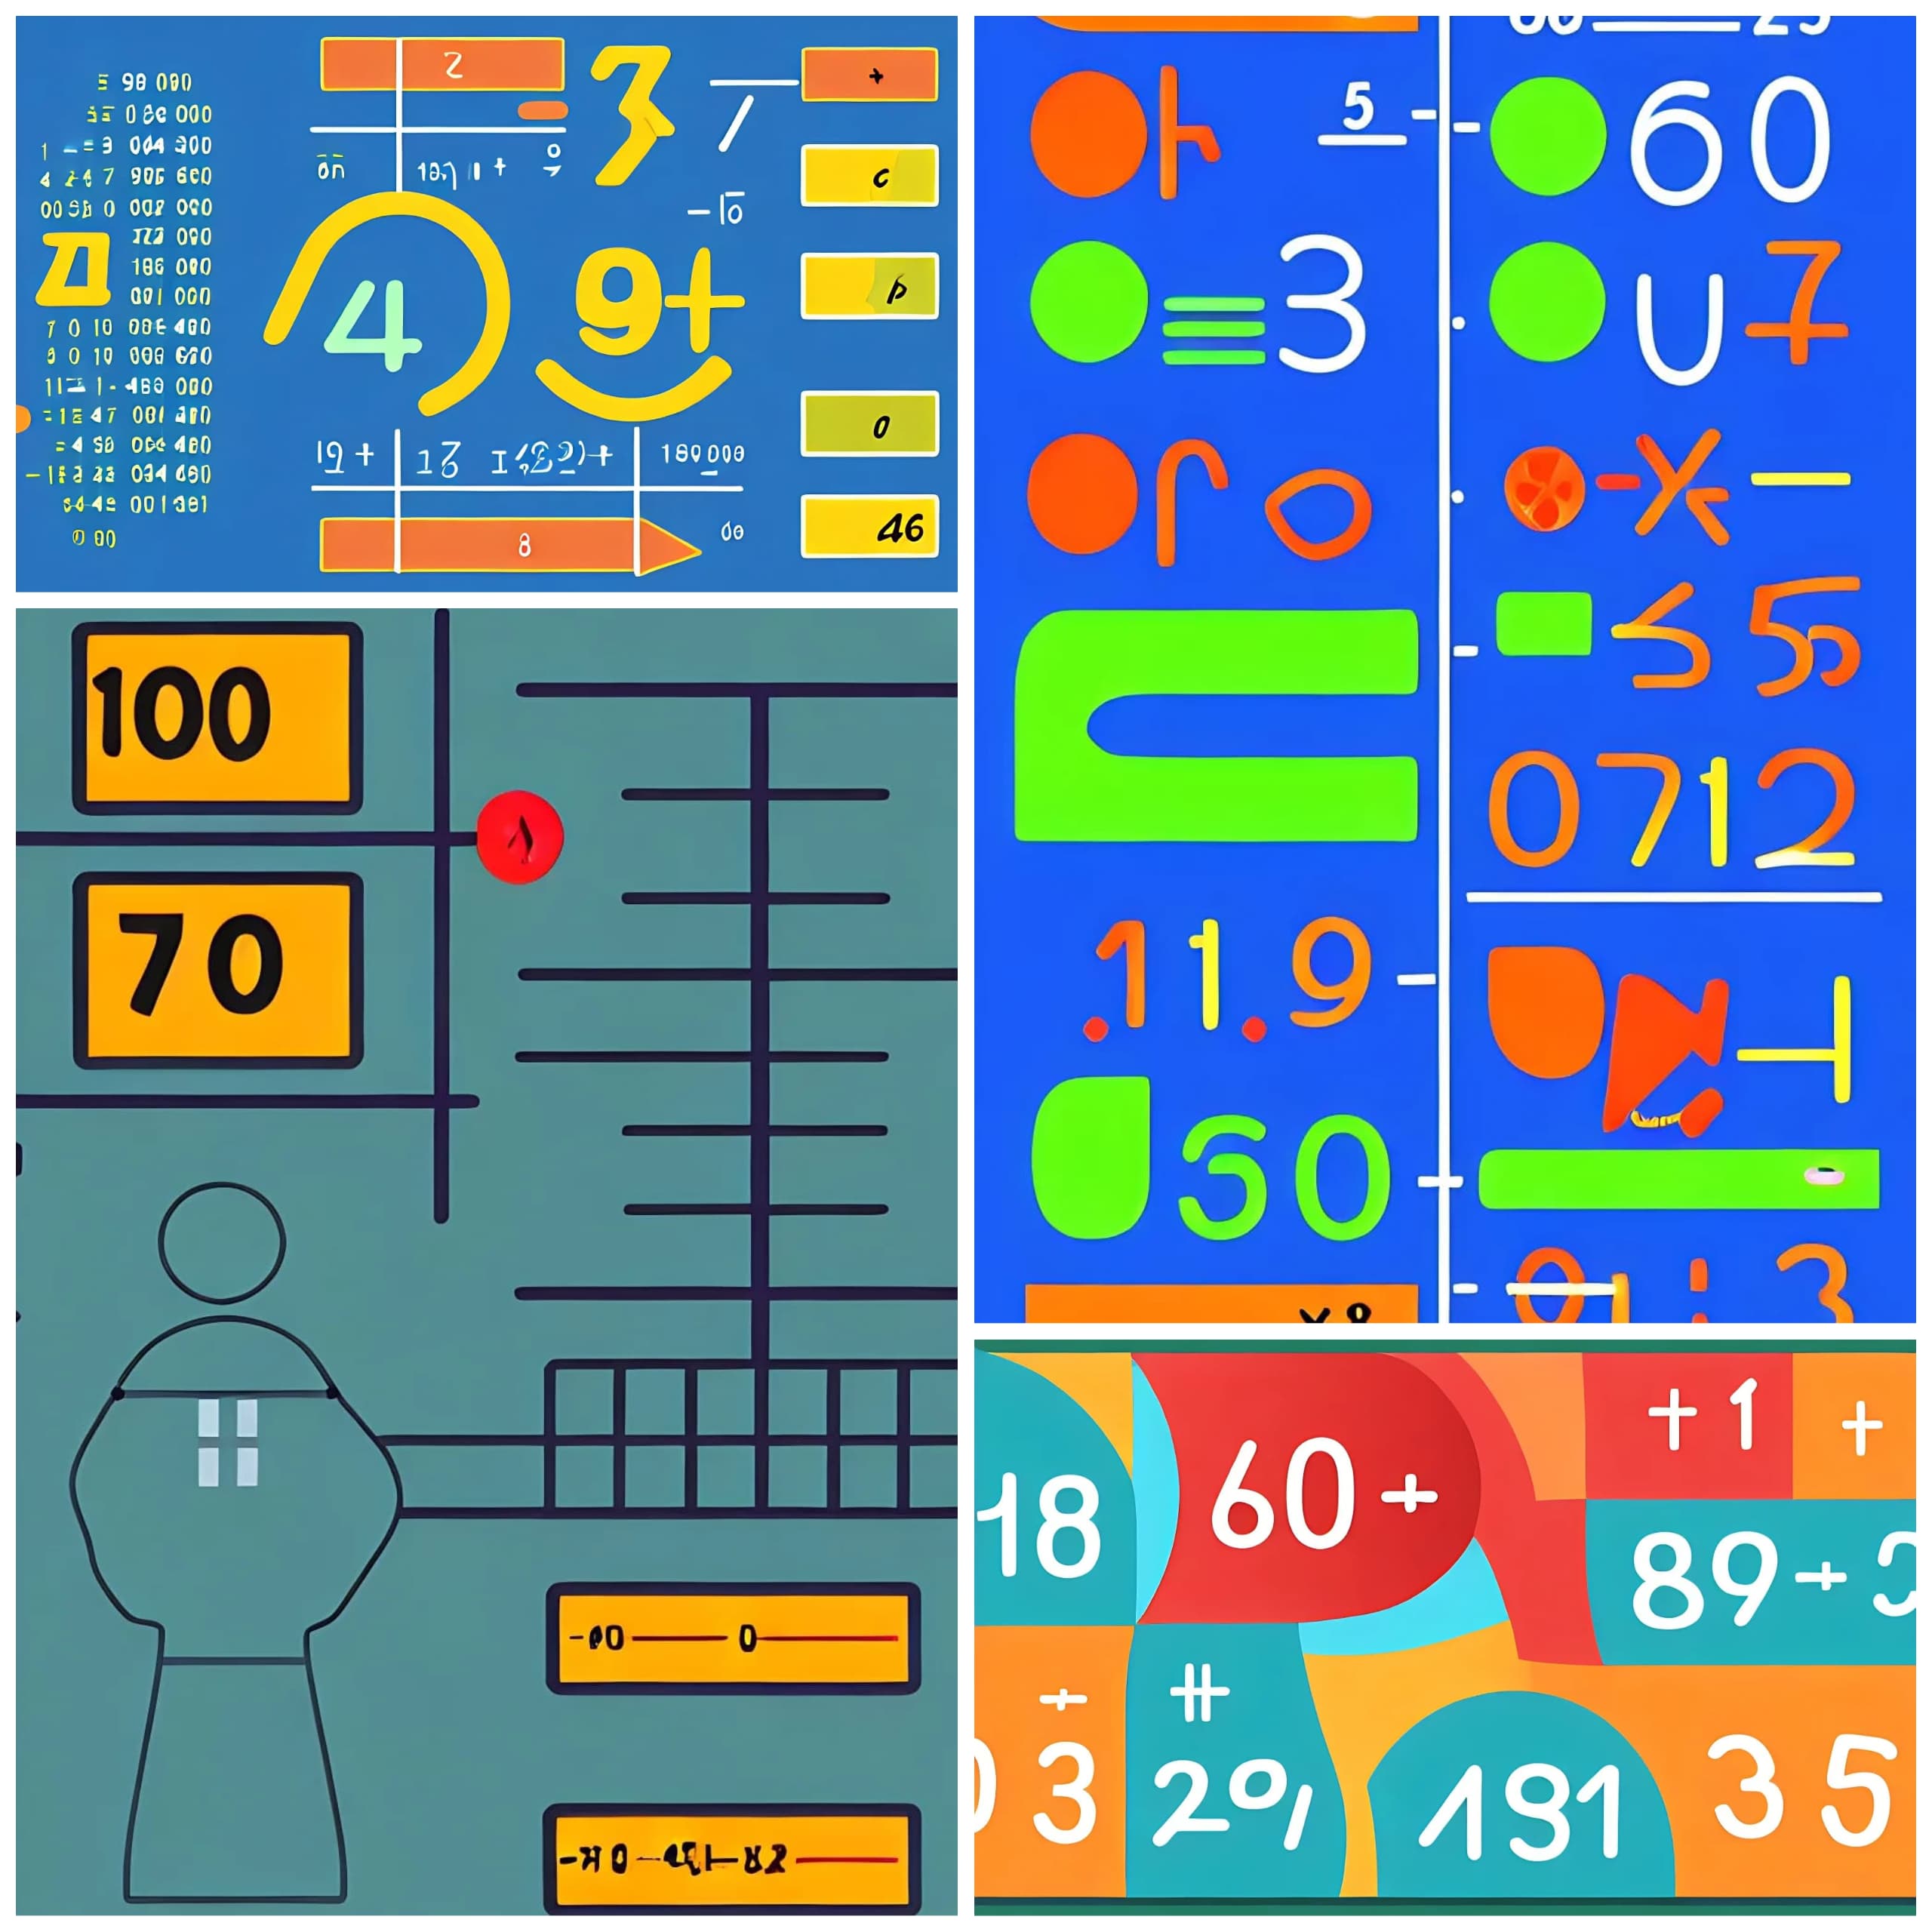
Infographic Illustration
math concept of max number, Infographic Illustration
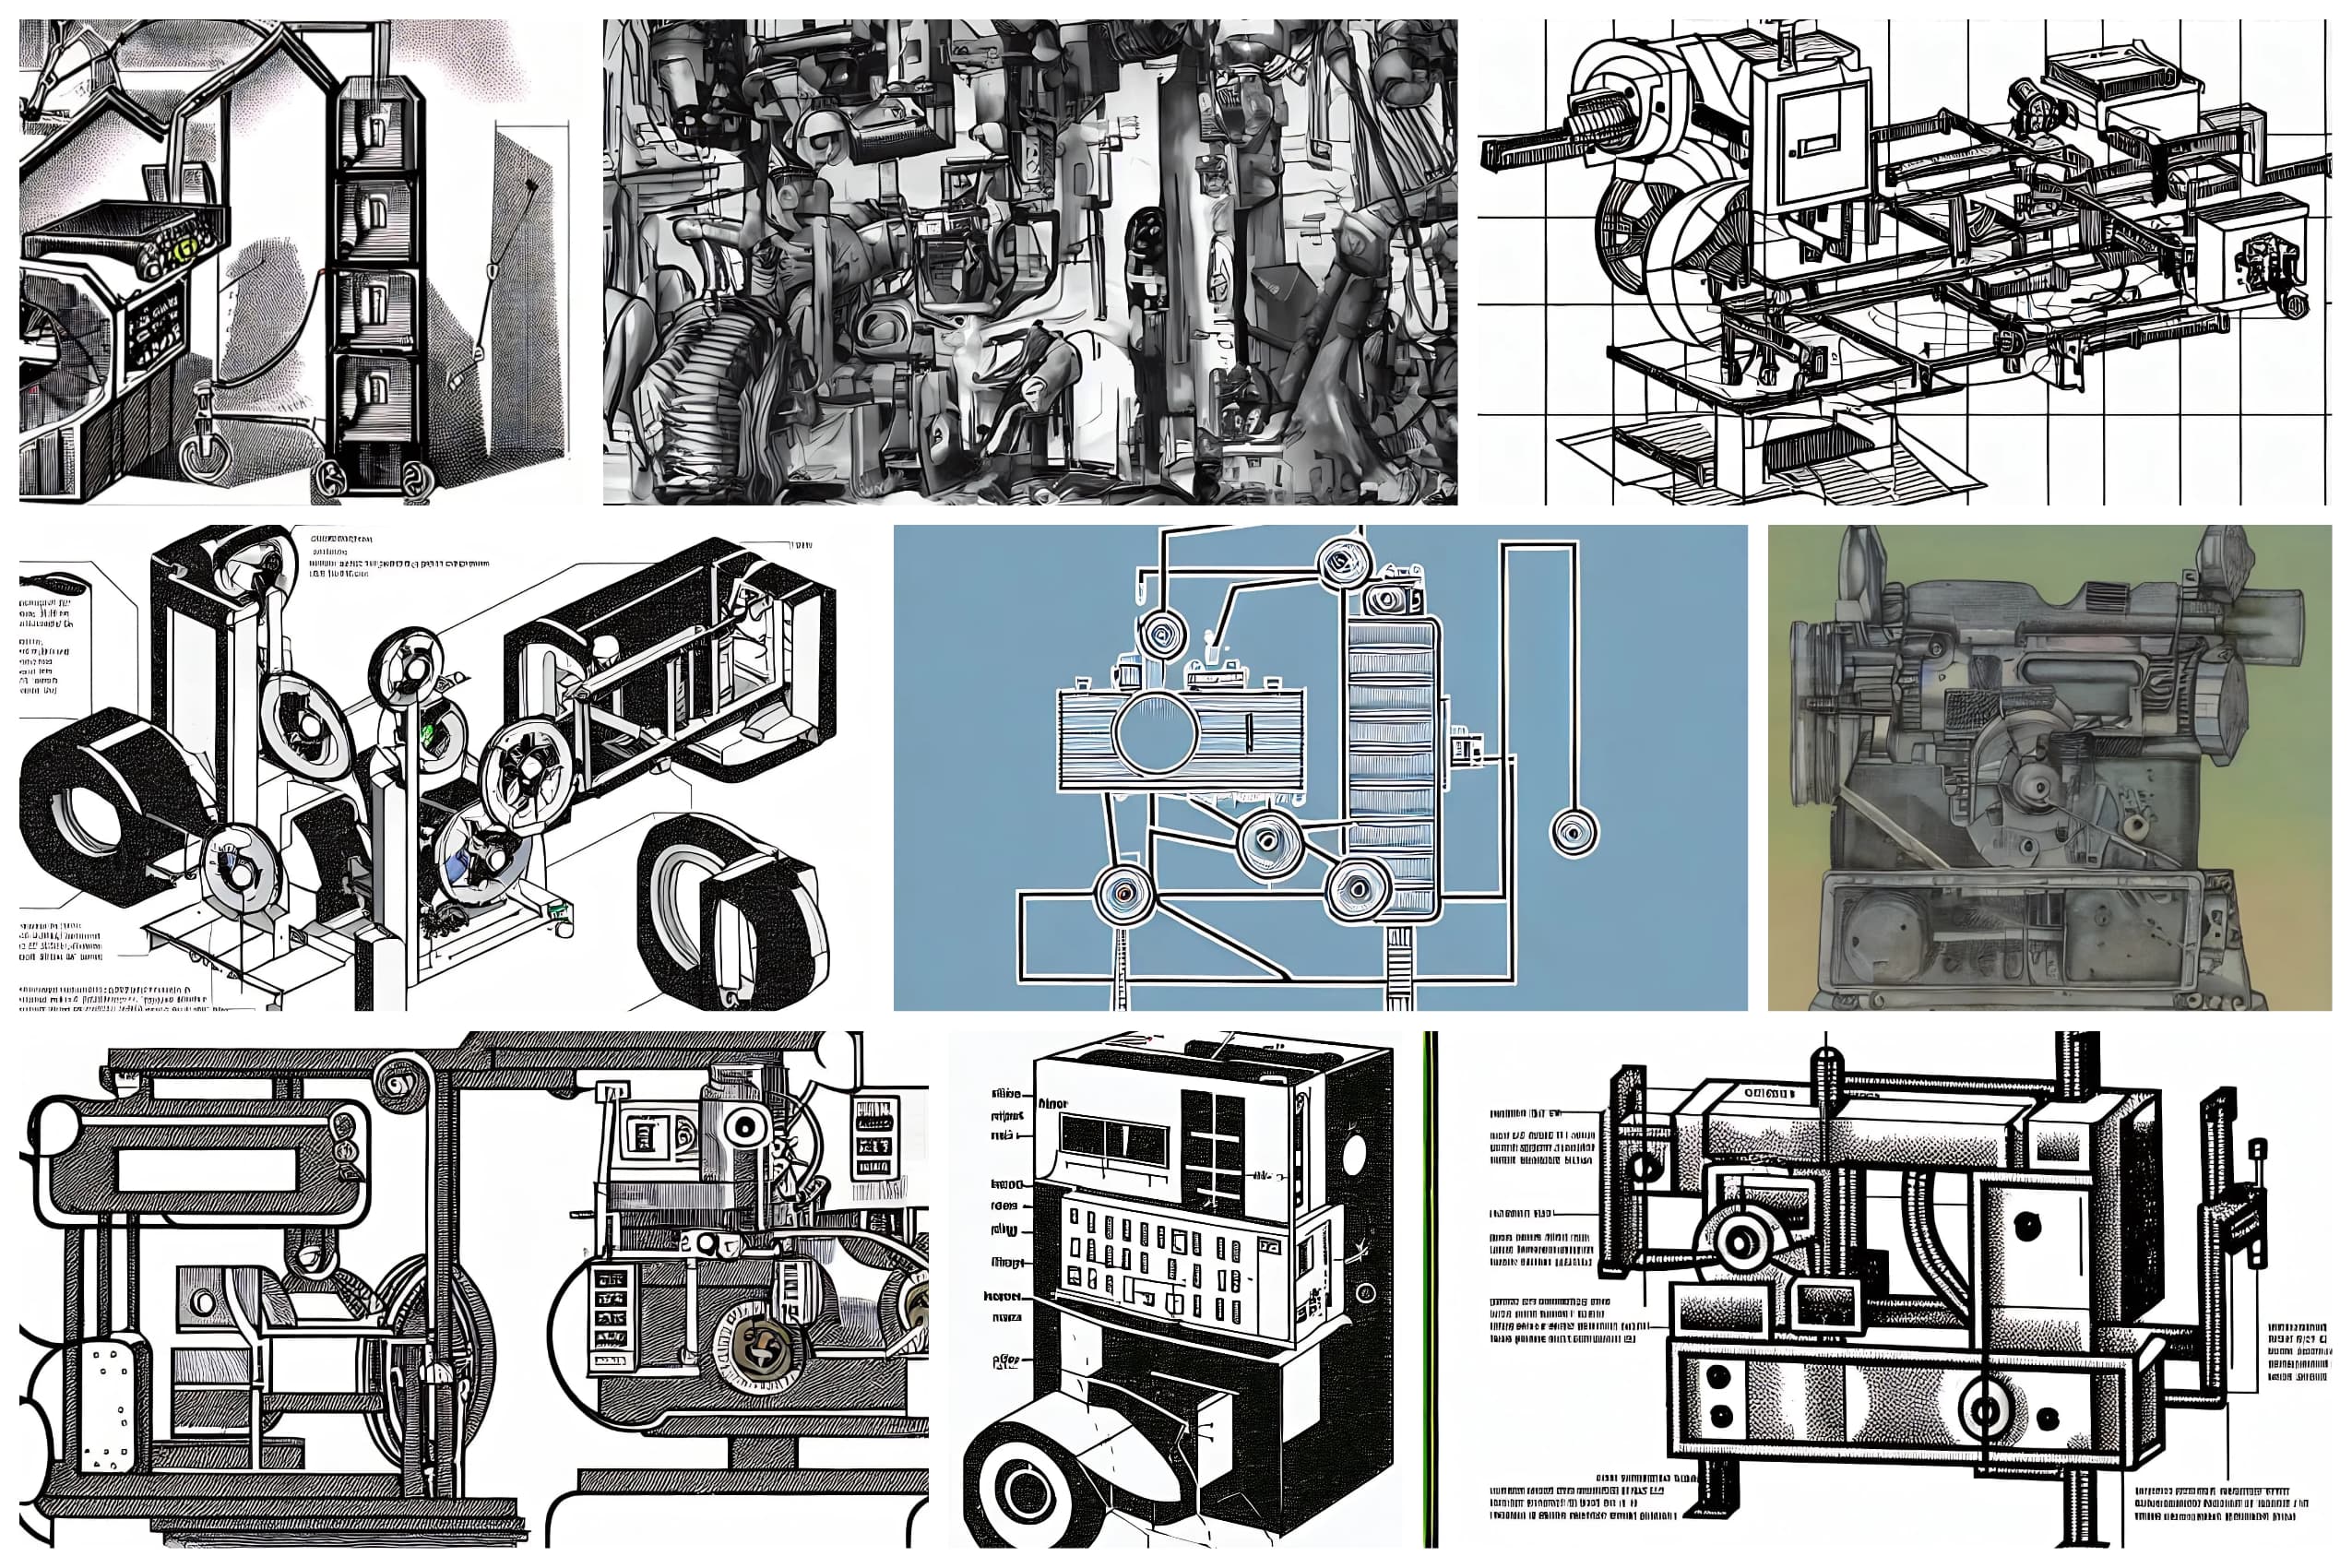
Diagrammatic Drawing
diagrammatic drawing of math concepts
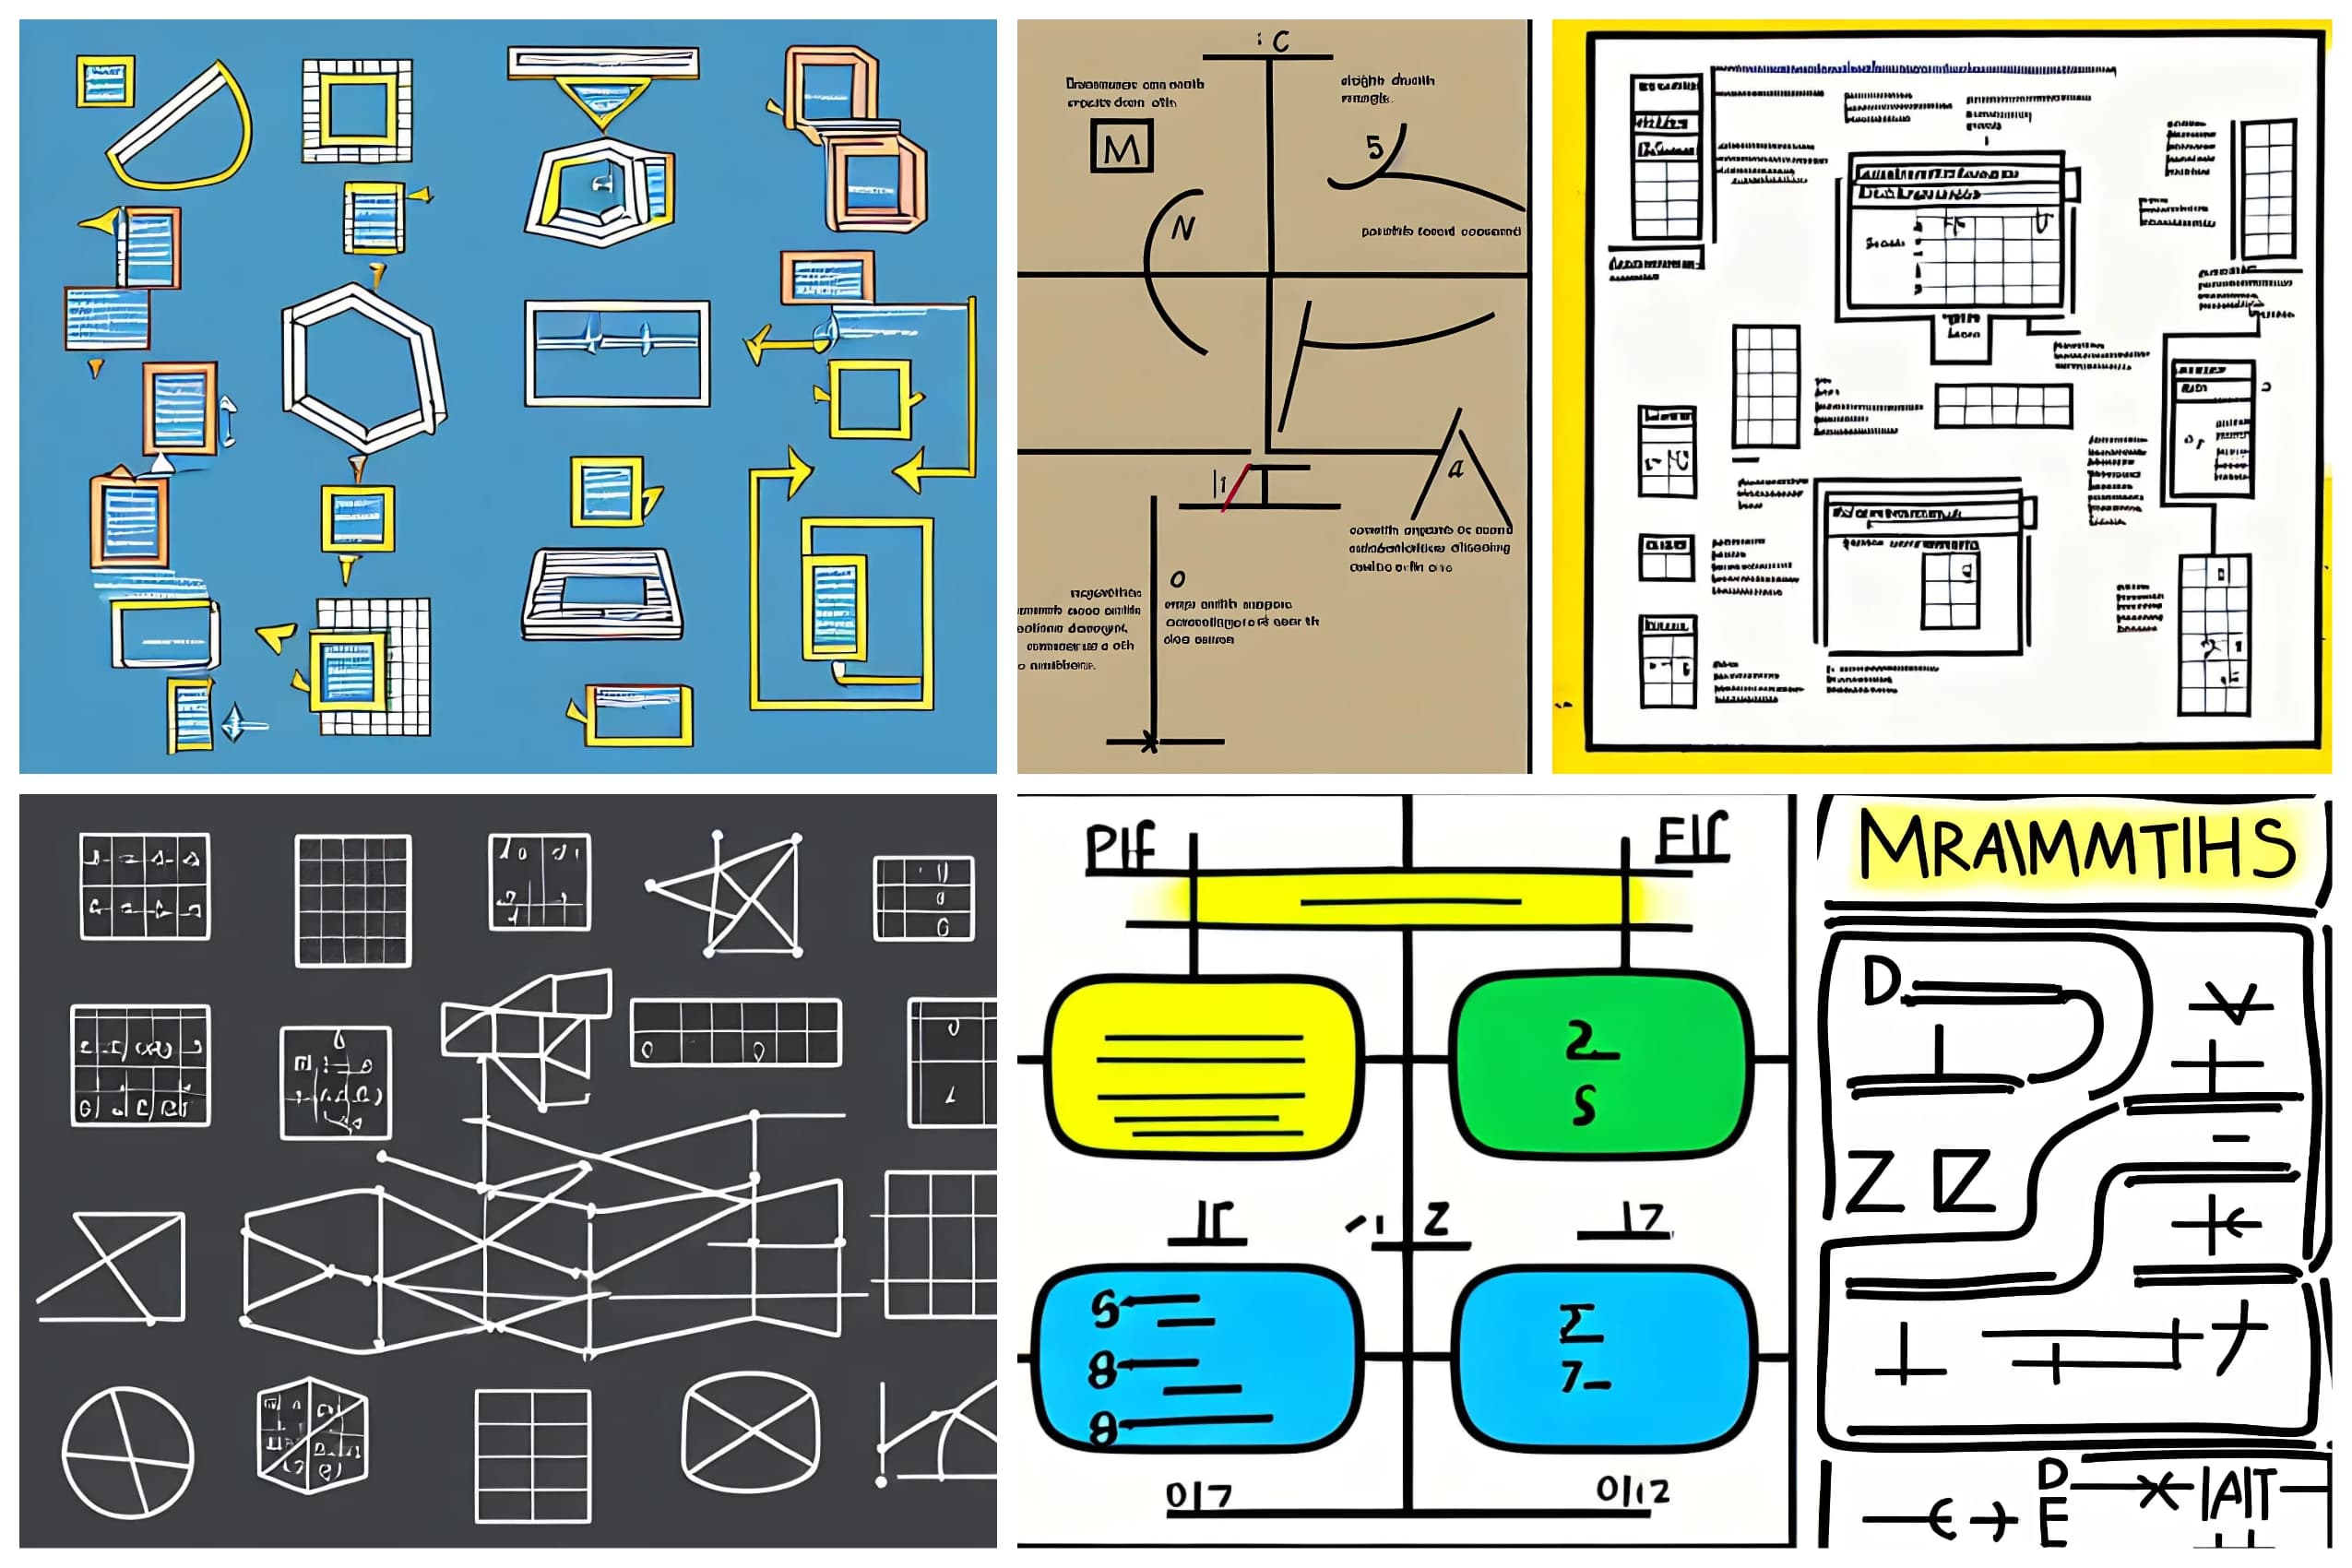
diagrammatic drawing of a machine to sum numbers
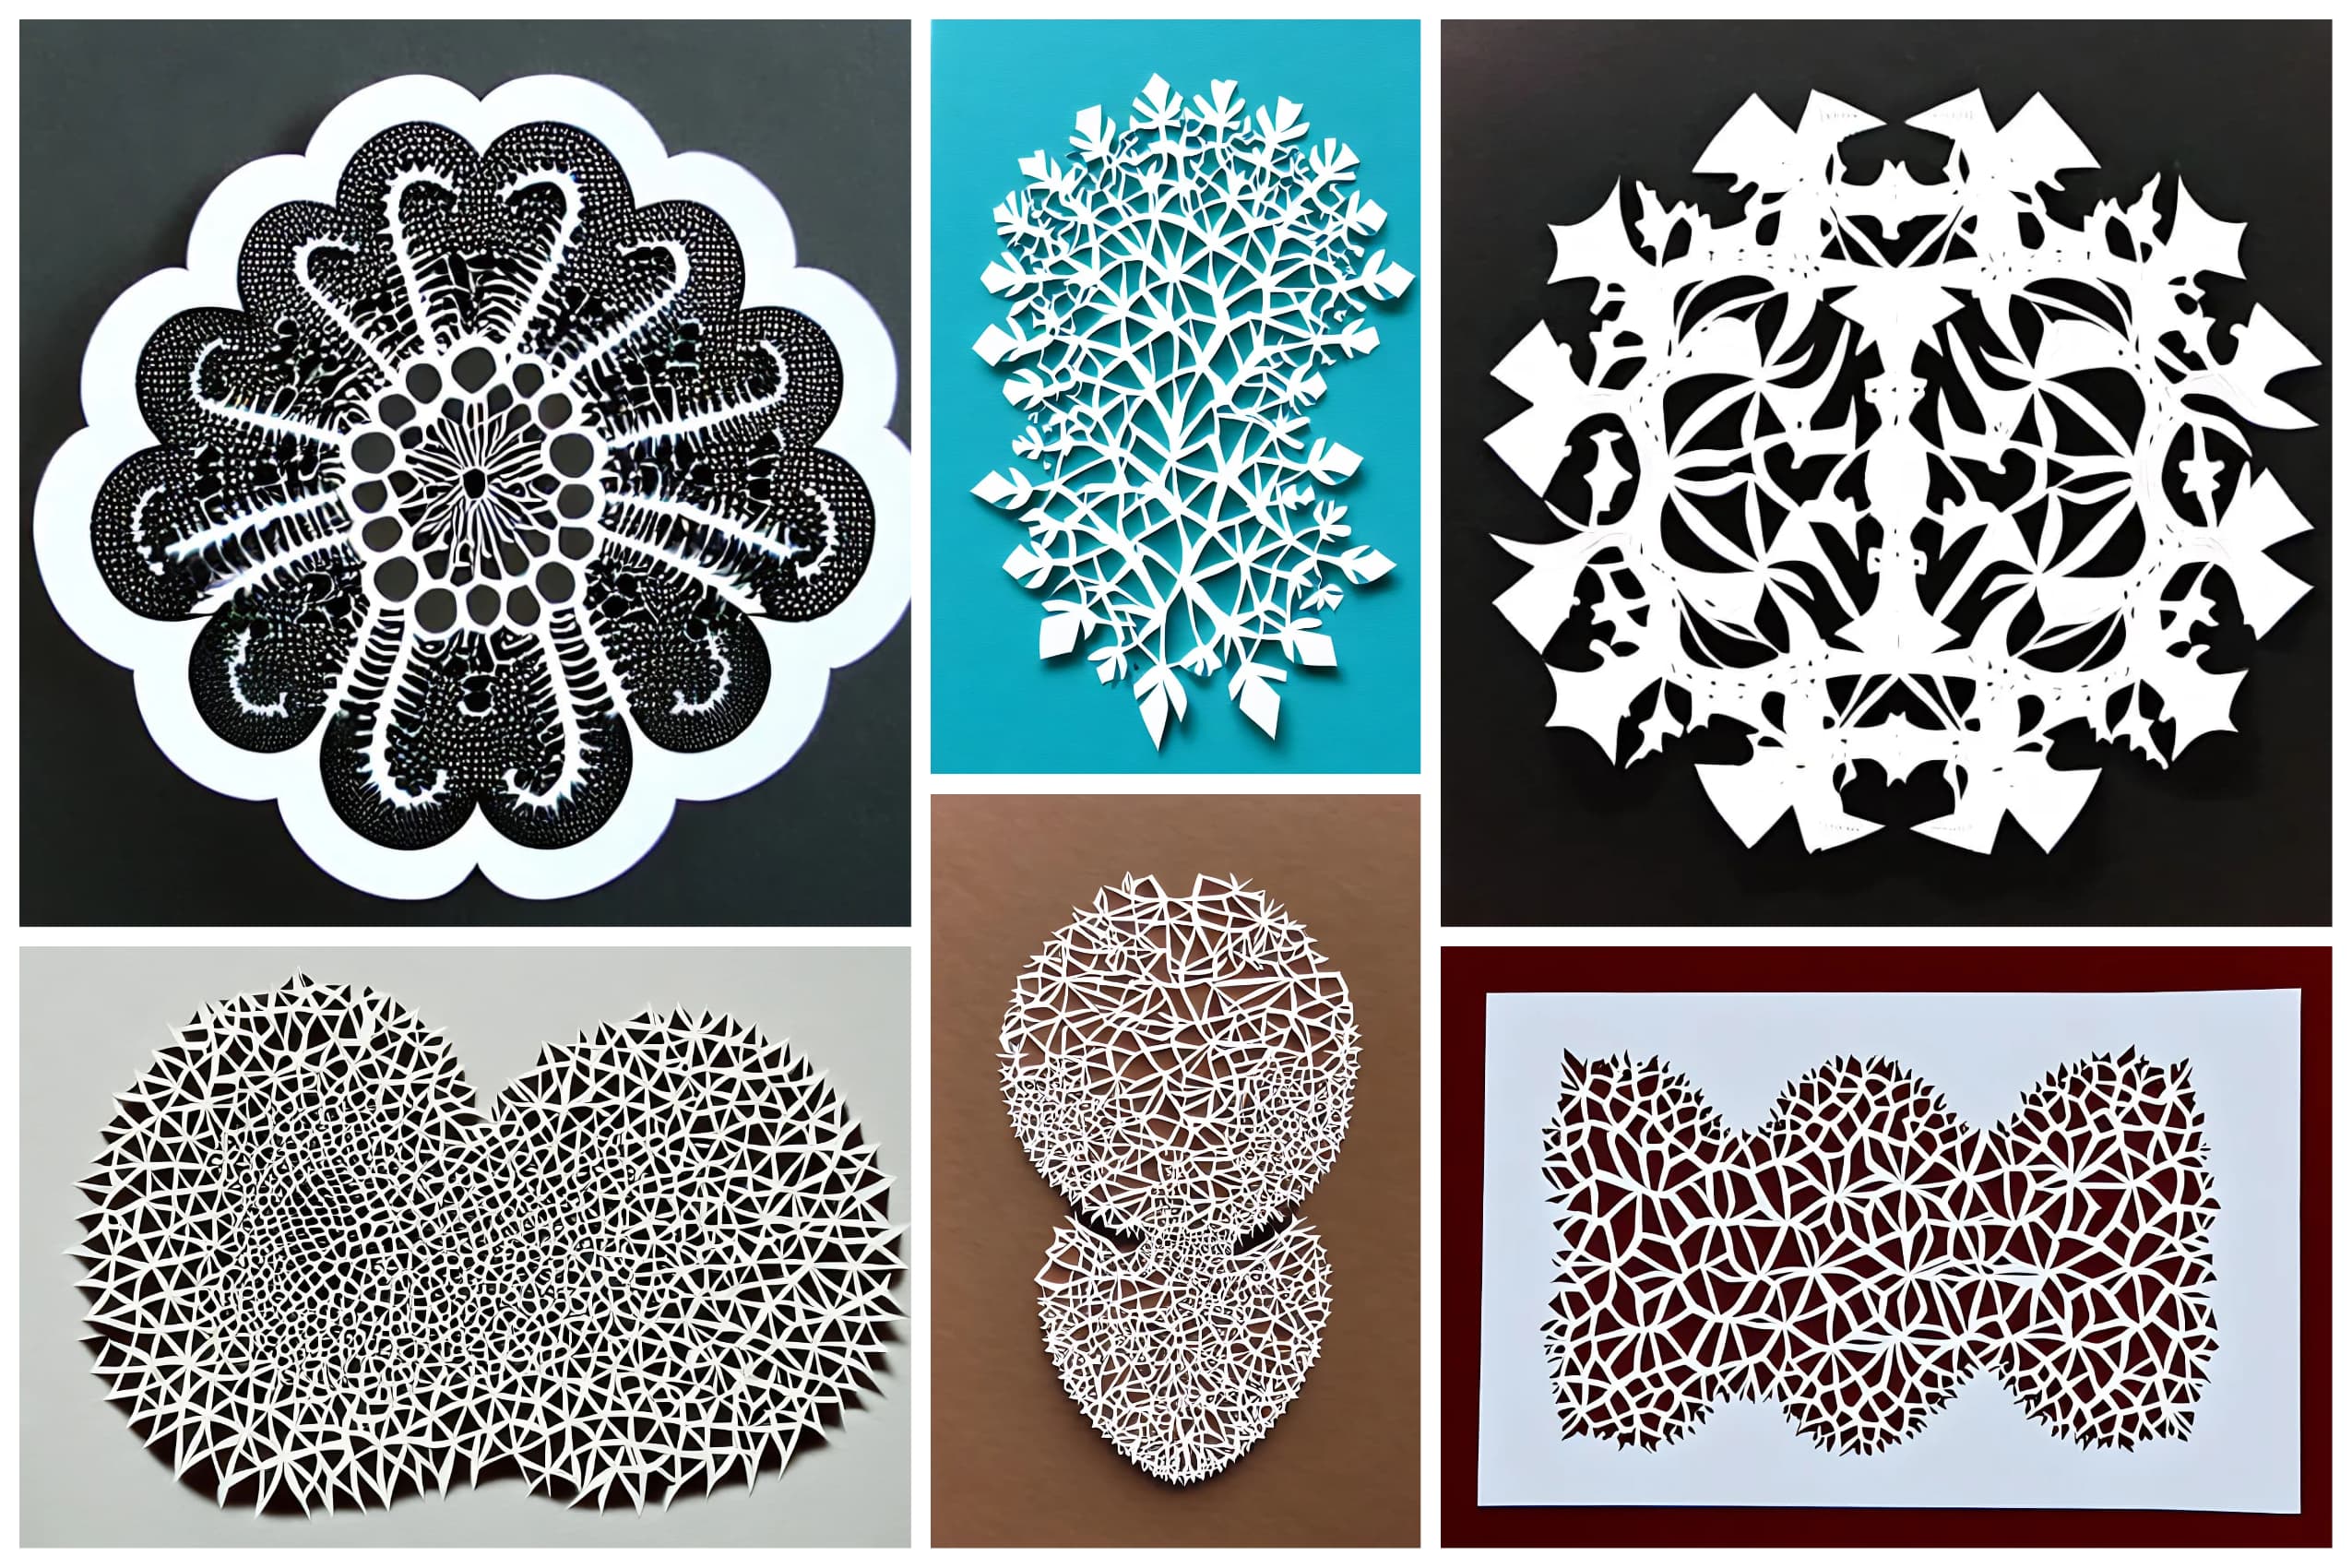
Paper Cut Craft Illustration
paper cut craft illustration of mandelbrot
Paper quilling
Paper quilling of math formula
